Climate change, with its increasing weather extremes, such as floods, extreme heat, and drought, is increasing the pressure by politicians and society to build buildings more sustainably. No surprise, as buildings are responsible for 40% of emissions and 33% of resource consumption worldwide. In Germany alone, 55% of waste generation is caused by construction and demolition waste. It is time to act.
Discussions around sustainability are happening everywhere, with many companies crafting solid sustainability statements and using sustainable building materials and labels.
So, how to “separate the wheat from the chaff” and find the right product for the desired application? We give you a first insight into the different types of environmental labels and see what is behind them.
Two Types of Eco-label
One example of certified environmental labels is the German environmental label “Blue Angel” of the Federal Environment Agency for environmentally friendly products and services. For this purpose, evidence of socially acceptable production conditions, material requirements, and indoor air quality needs declaration and consumer information and use must be provided.
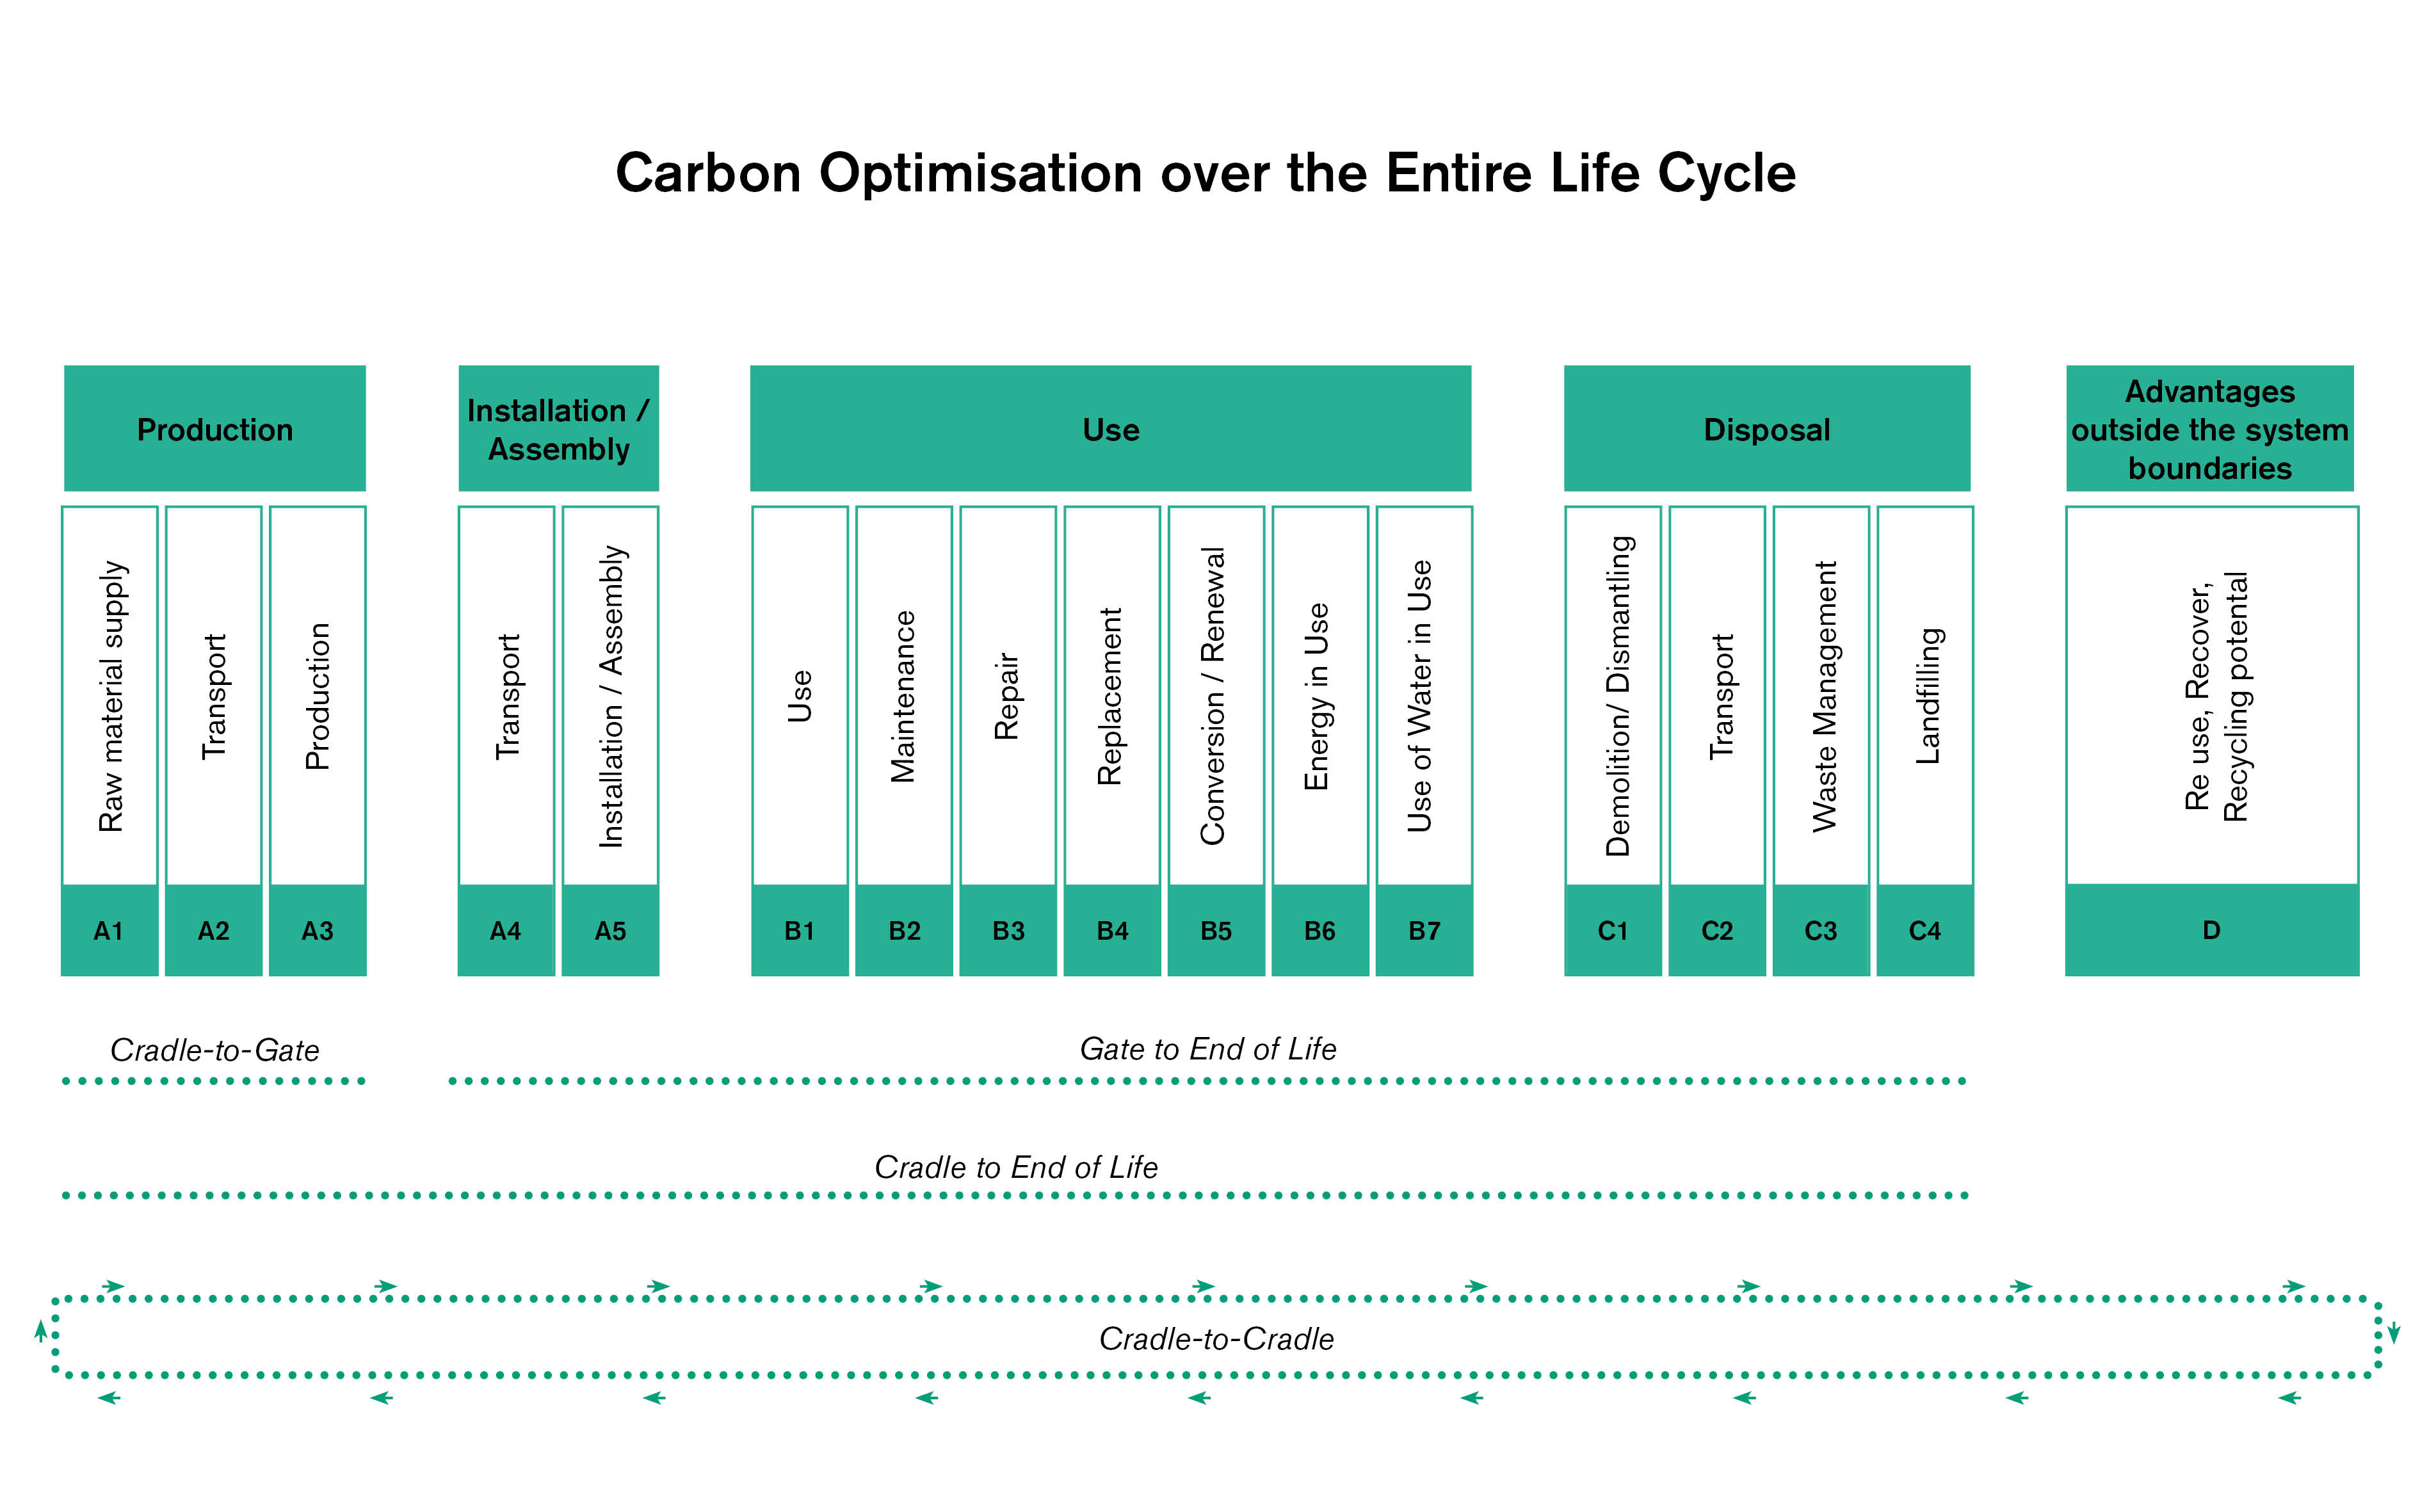
Another example is the Cradle-to-Cradle certification. It is published by the Cradle-to-Cradle Product Innovation Institute, with offices in the USA and the Netherlands. Products are tested against a comprehensive catalogue of criteria in five areas: material health, recyclability, social fairness, water and soil management, clean air and climate protection. Depending on the degree of fulfilment, the certificate is assigned to one of four levels: bronze, silver, gold, or platinum. Across the entire catalogue of criteria, the lowest level of the achieved category determines the overall level.
Both types of environmental labels provide purely qualitative statements about a product. Certified environmental labels are predefined requirements of a third party for the products that must be met. If you want more detailed information or a comparison with your own environmental requirements, you must look at each institution’s requirements catalogue. Concrete product-specific figures can usually only be found to a limited extent.
Valid, Third-party Verified and with Measurable Results
Verified Environmental Product Declarations provide the potential environmental impact of a product based on precise data, facts and figures on a range of environmental data. These are presented in three categories: emissions, resource use and waste types. The environmental impact is specifically quantified and presented with the addition of the life cycle of a product or a product group.
Product-specific EPDs are more accurate than EPDs for product groups of one manufacturer or EPDs for manufacturer-independent product groups. In addition, an EPD contains detailed information on the material use of a product as well as other selected features for product specification.
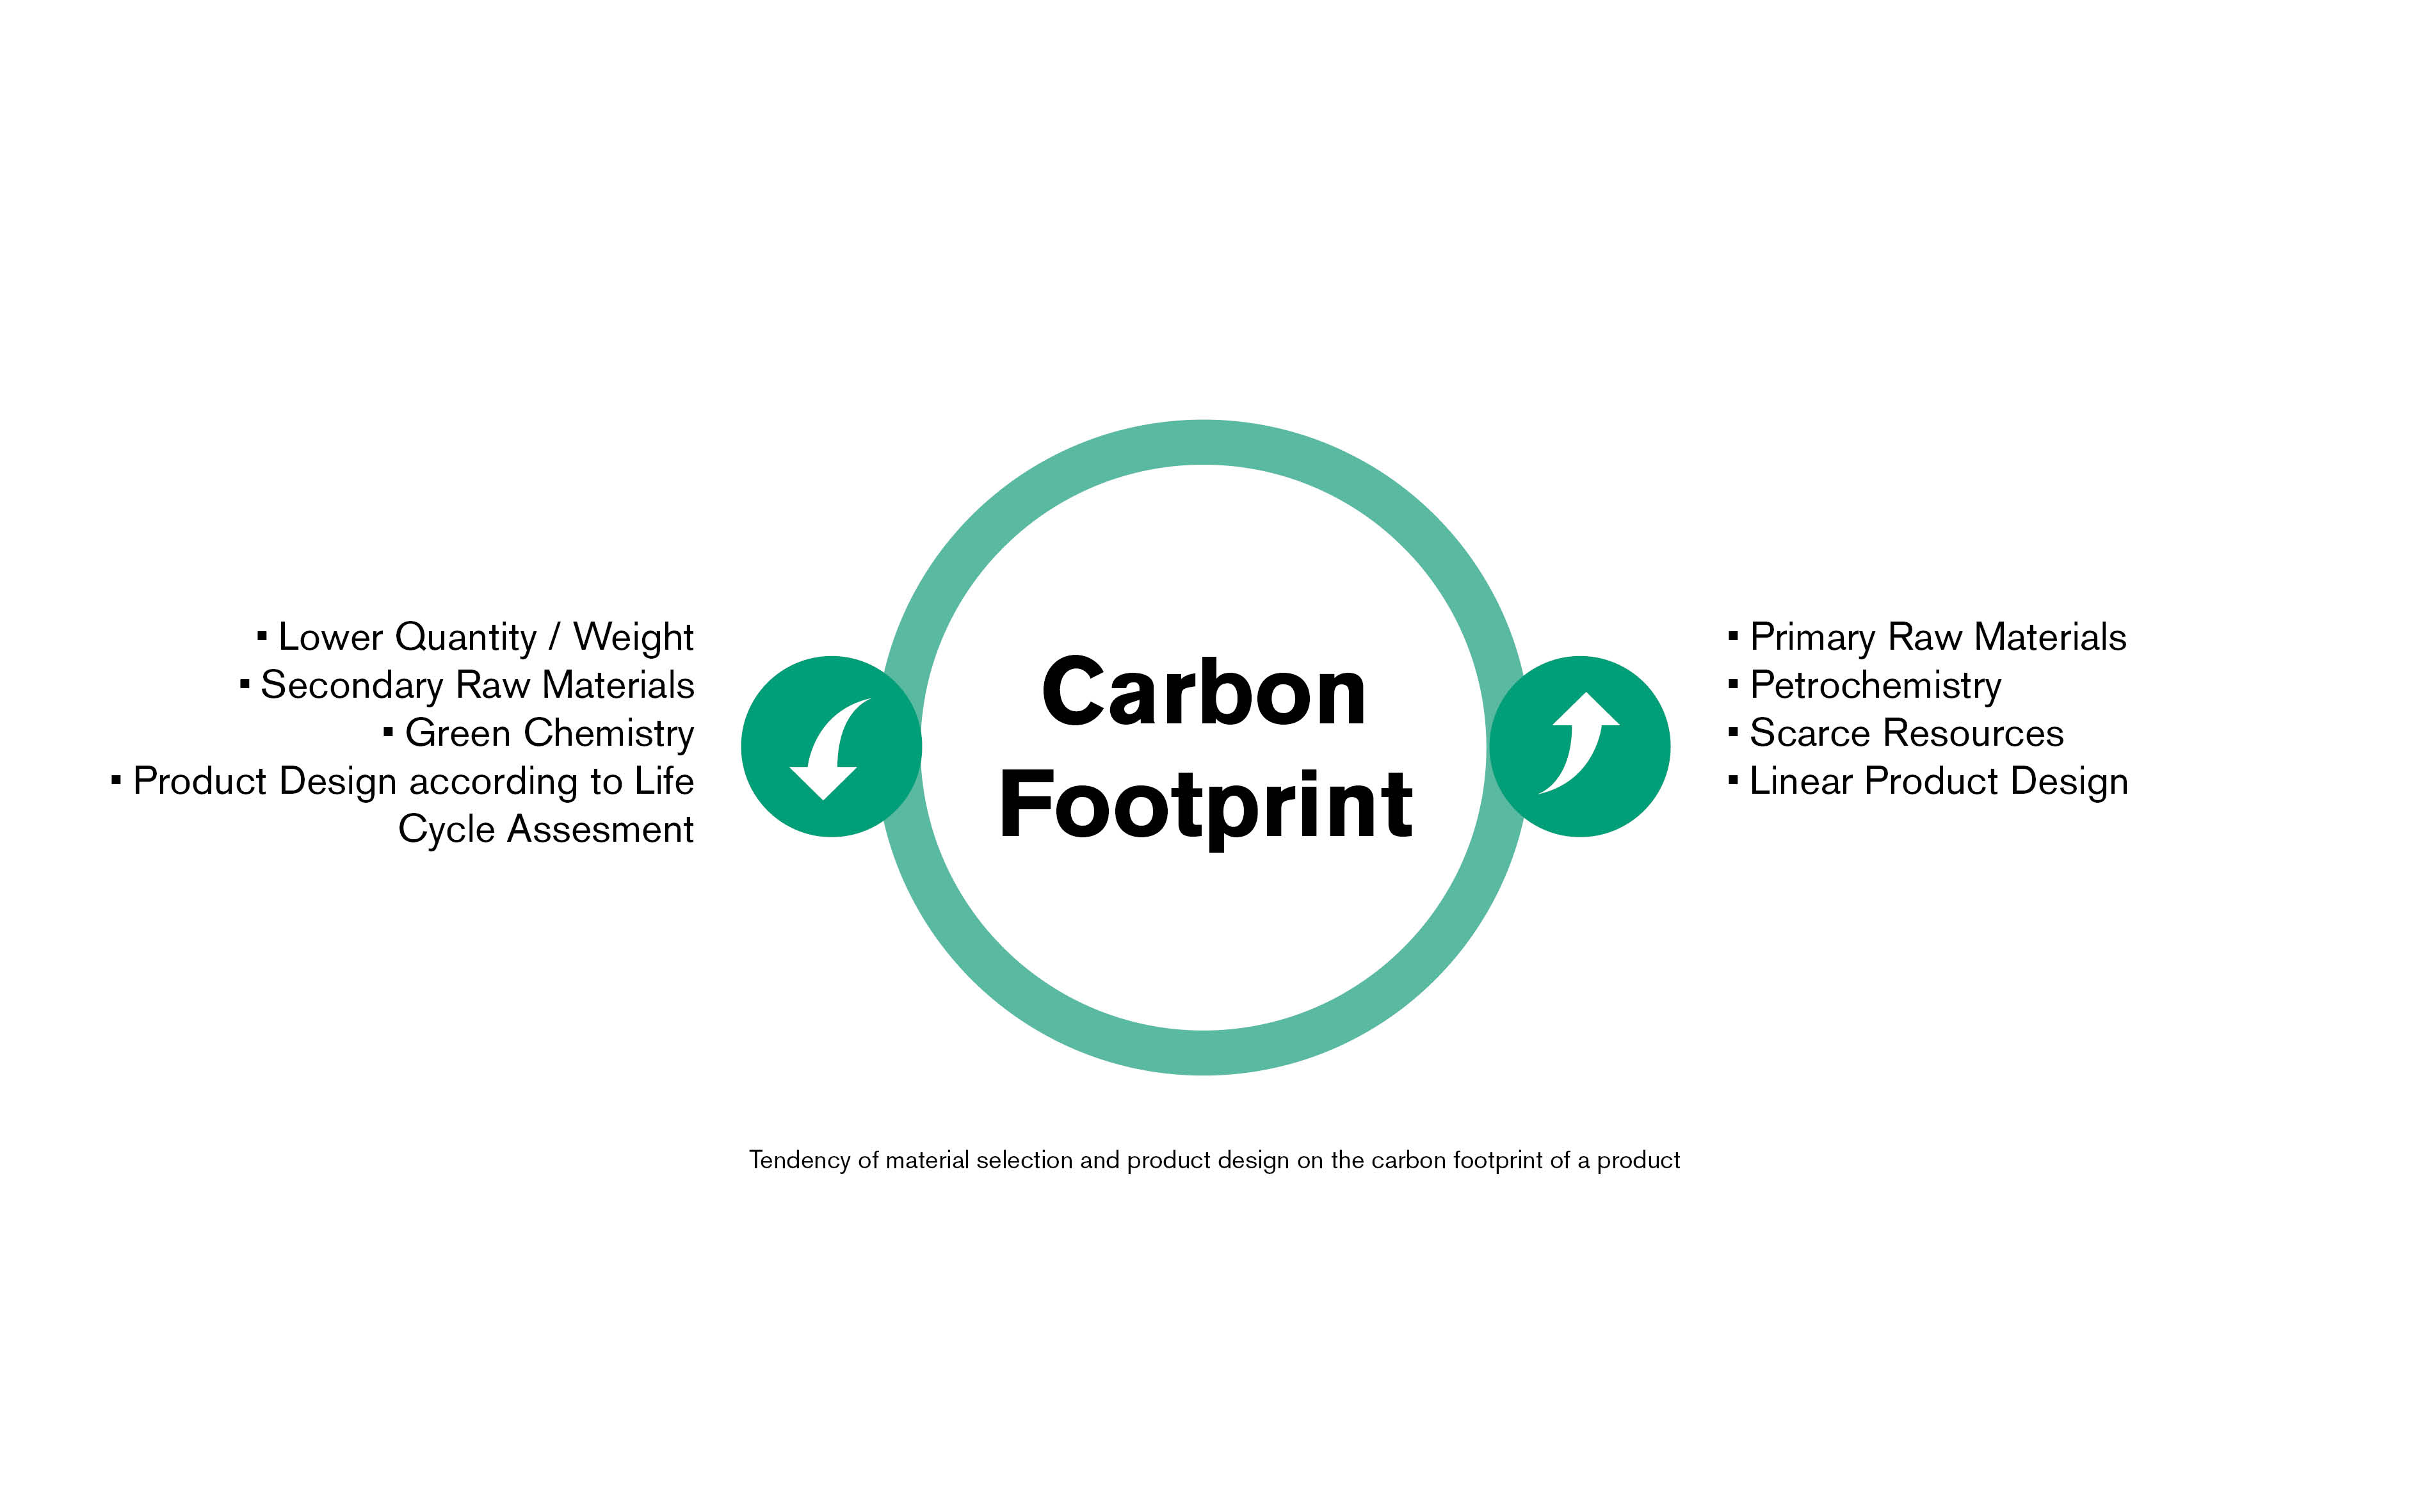
How does product design affect the carbon footprint? Carbon drivers in flooring are:
- The yarns of the wear layer are dependent on which materials are used (depending on primary or secondary raw materials used).
- Production processes: Inefficient processes and a low proportion of renewable energies, for example, increase the carbon footprint.
- Petroleum-based materials in the backing construction, such as bitumen or PVC: the higher the proportion, the higher the carbon footprint.
- The amount of materials used: more weight leads to a higher carbon footprint.
The Difference Can Be Huge
Interface has de-materialised its products (they contain a high proportion of bio-based and recycled materials) to ensure they offer a low carbon footprint; this has been the case since 2021, and it hasn’t affected the products’ performance. They are also bitumen and PVC-free. Depending on the product, the carbon footprint is up to -1.1 kg CO2e/m². These carpet tiles contain more bound carbon in the form of biobased materials than carbon emissions are emitted during the phase of raw material extraction over transport and actual production (cradle-to-gate phase). Thus, the floor coverings serve as CO2 sinks in the building.
And what is the carbon footprint, e.g., from the newest collection? Here is the data and a calculation example. 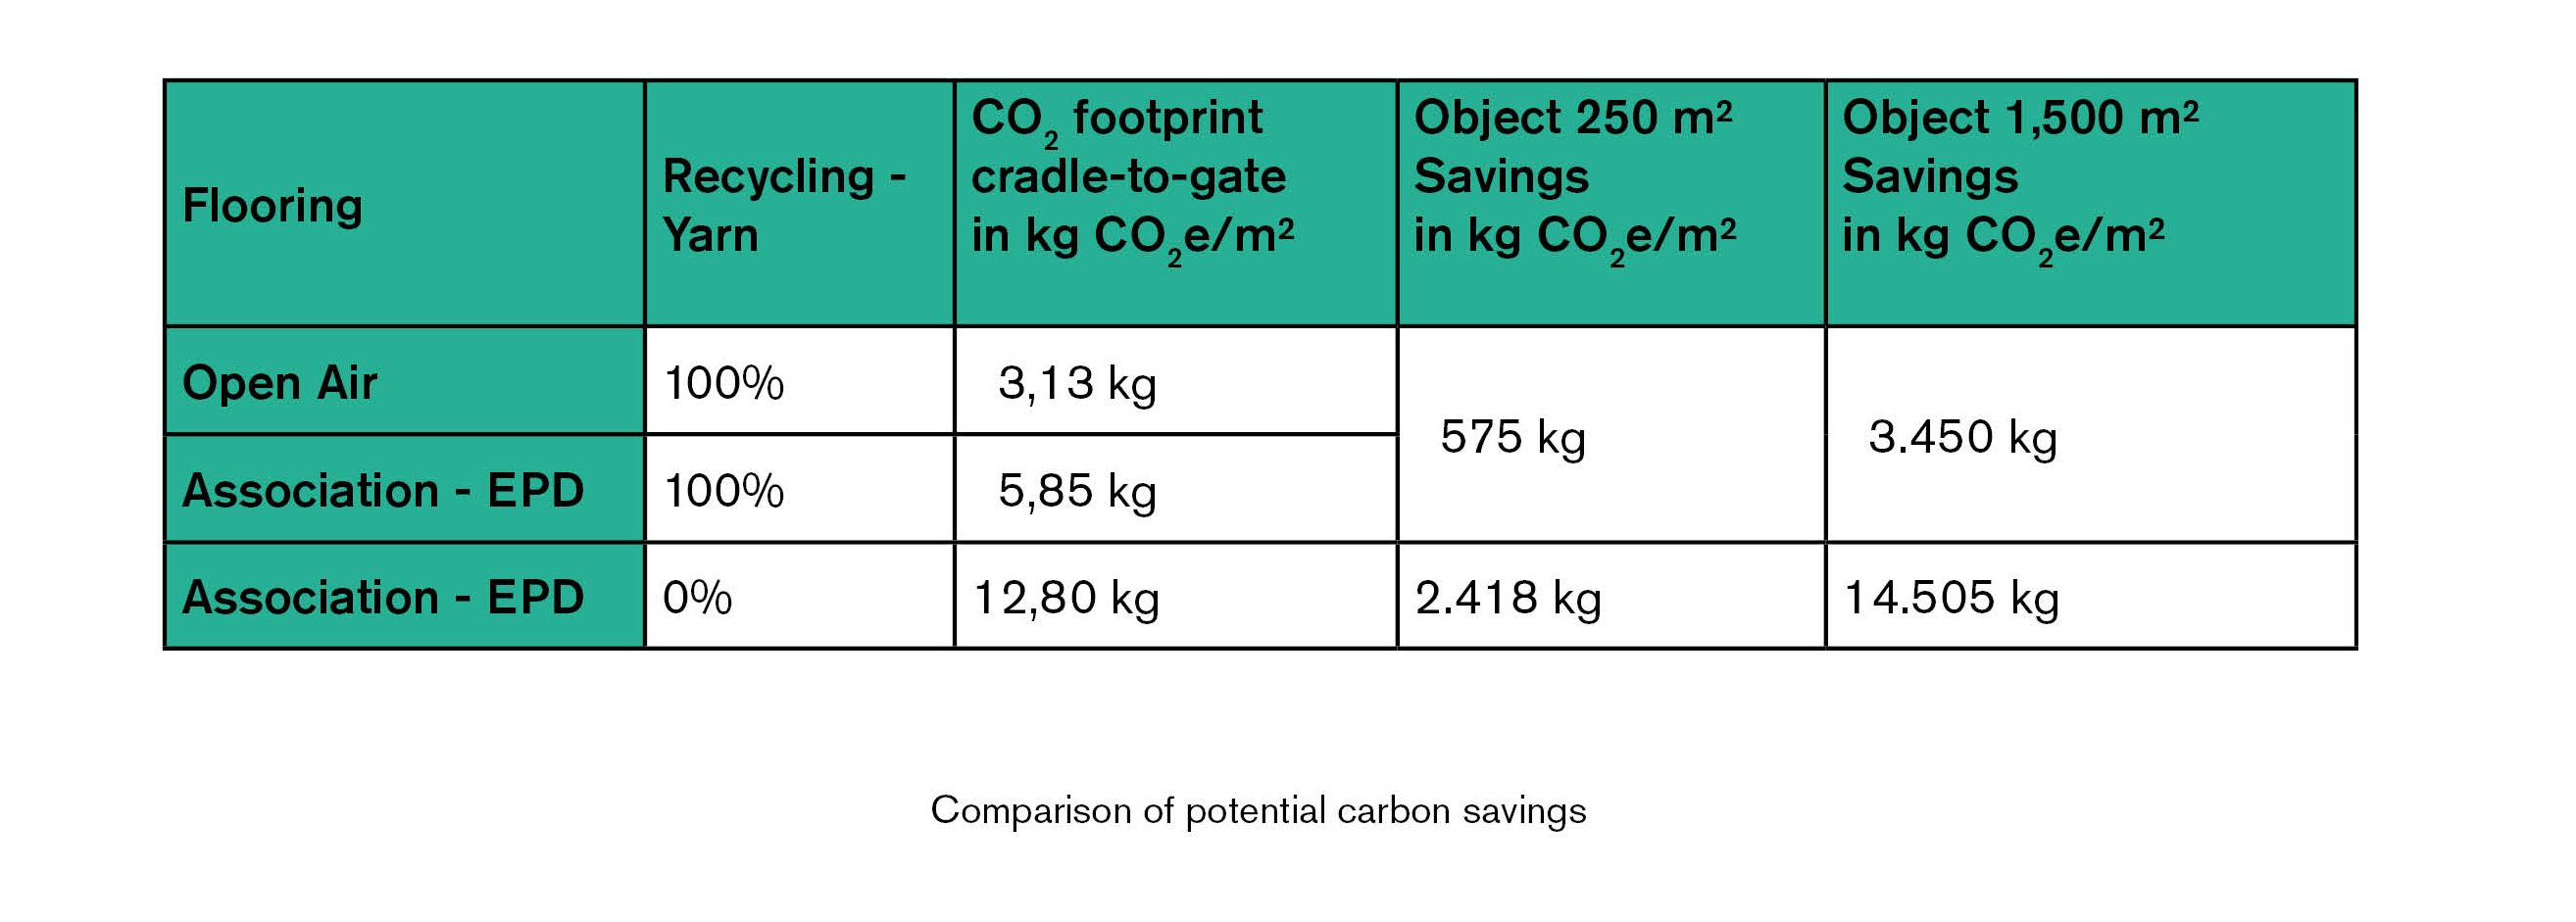
The carbon footprint (cradle-to-gate) of the new carpet tile collection Open Air (with 100% recycled yarn) is 3.13 kg CO2e/m². In comparison: The carbon footprint per m² in the association EPD is staggered between 400 g and 800 g, depending on the weight of the pole insert.
- for 100% recycled yarn at 5.43 kg (400 g), 5.85 kg (600 g) to 6.28 kg (800 g)
- for 0% recycled yarn, from 10,8 kg (400 g) to 14,9 kg (800 g).
The potential embodied carbon savings when using open air with 100% recycled polyamide in a 250 m² or 1,500 m2 facility are 575 kg and 3,450 kg, respectively, compared to the values in the association’s EPD. The difference is even more apparent if no recycled yarn is used: the savings here reach values of 2,418 kg and 14,505 kg, respectively.
No matter whether certified environmental labels or verified environmental data: When it comes to sustainable building materials, it is necessary to take a closer look at both cases. For information on the most urgent concern for sustainable buildings, the carbon savings, the EPD with the valid verified data is indispensable. This is particularly true regarding the increasing digital solutions such as BIM models, building passports or life cycle assessments, and in the context of building certifications.
In light of the proposed rules of the EU (March 2023), the “Directive on Green Claims”: the future belongs to transparency and measurable data – the EPD is currently the best tool for this and will gain central importance as a “fact checker”.